Visual Studio
Git Tools
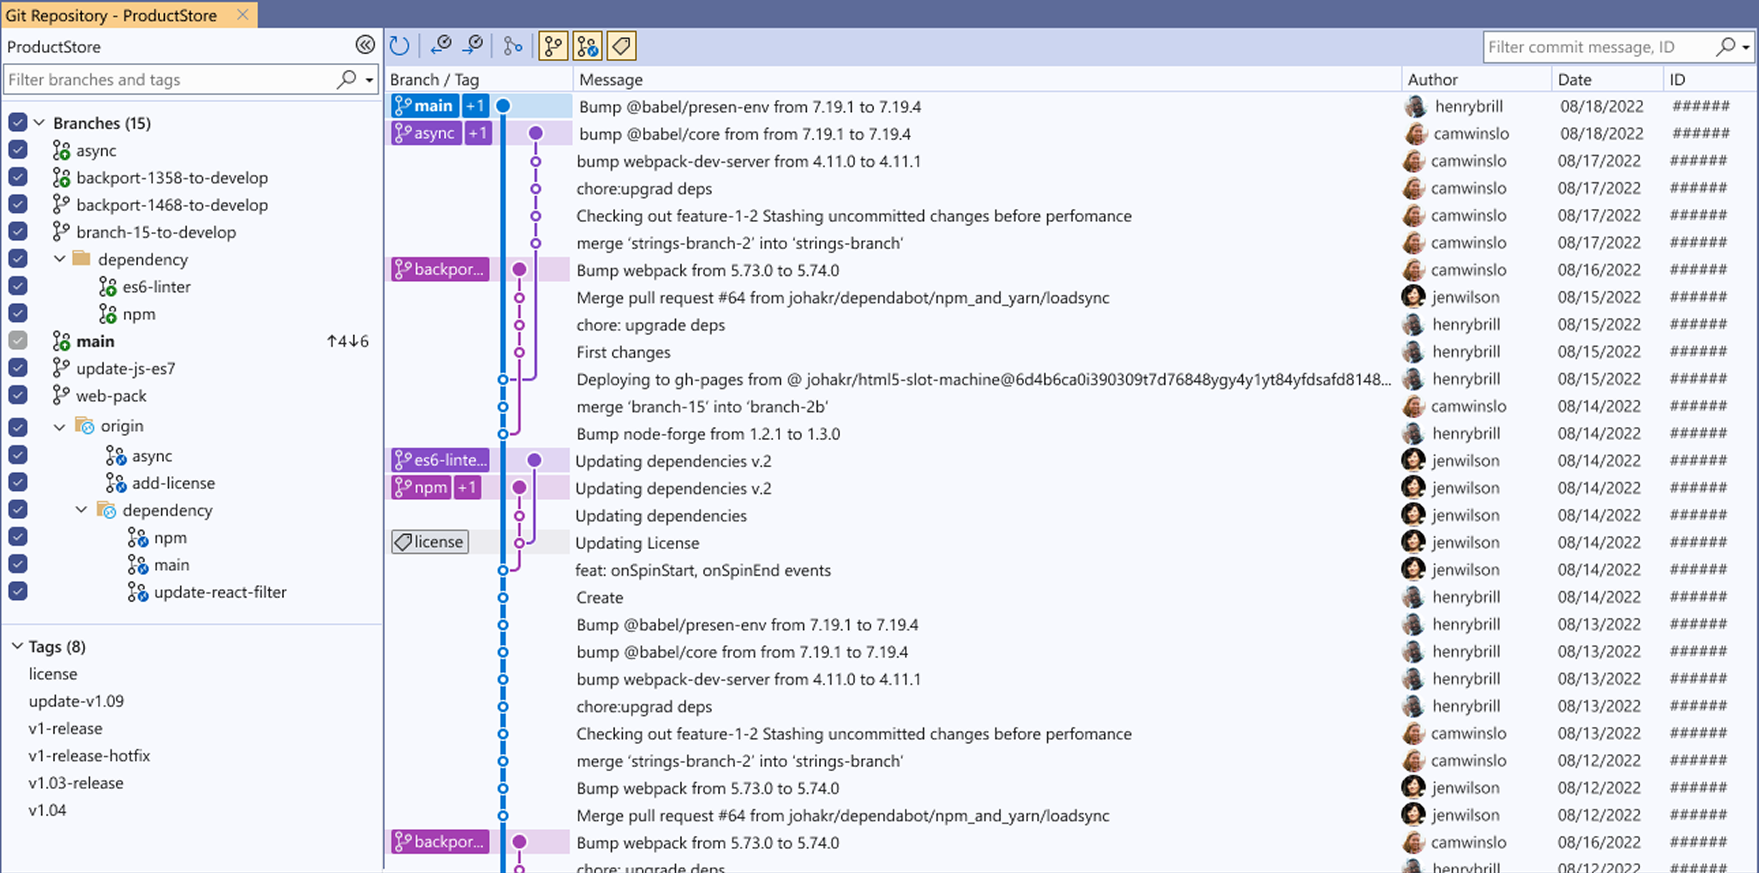
Spearheading the design and launch of the WCAG-compliant Multi-Branch Graph for Visual Studio scaling adoption from 8.5 million to 14 million users by delivering an accessible, modern Git visualization tool for developers of all abilities.
14M
Users at peak adoption
+60%
User growth (8.5M → 14M)
−1 mo
Delivery accelerated
100%
WCAG compliant
Overview
The problem worth solving
Visual Studio had supported Git for years but developers managing complex multi-branch workflows were increasingly abandoning the IDE's native tools in favor of third-party alternatives. The core issue: there was no accessible, at-a-glance way to visualize branch topology inside Visual Studio.
The existing tooling presented branches as flat lists with no graph context. For developers juggling feature branches, hotfixes, and release tracks simultaneously, this was a daily source of friction and a meaningful barrier for developers with visual impairments who relied on accessible data representations.
My mandate as Senior UX Designer (contract) was to design and ship a WCAG-compliant Multi-Branch Graph a native branch visualization that could compete with the best third-party tools while meeting Microsoft's Accessibility Standards without compromise.
Key Contributions
- Scaled Multi-Branch Graph from 8.5M → 14M users through improved usability and accessibility
- Delivered 100% WCAG-compliant and Microsoft Accessibility standard solutions, ensuring complex data visualizations remained accessible to developers with visual impairments
- Accelerated delivery by 1 month via Lean UX and weekly usability validation cycles
- Influenced product direction through close partnership with PM and engineering on developer workflows
- Owned end-to-end design for Git tooling used by millions of developers
Role
Senior UX Designer (Contract)
Client
Microsoft
Timeline
Nov 2020 – Apr 2022
Platform
Visual Studio (Windows Desktop)
Methodology
Lean UX, weekly usability cycles
Standards
WCAG 2.1 AA, Microsoft Accessibility Standards
Tools
Figma, Azure DevOps, Clarity
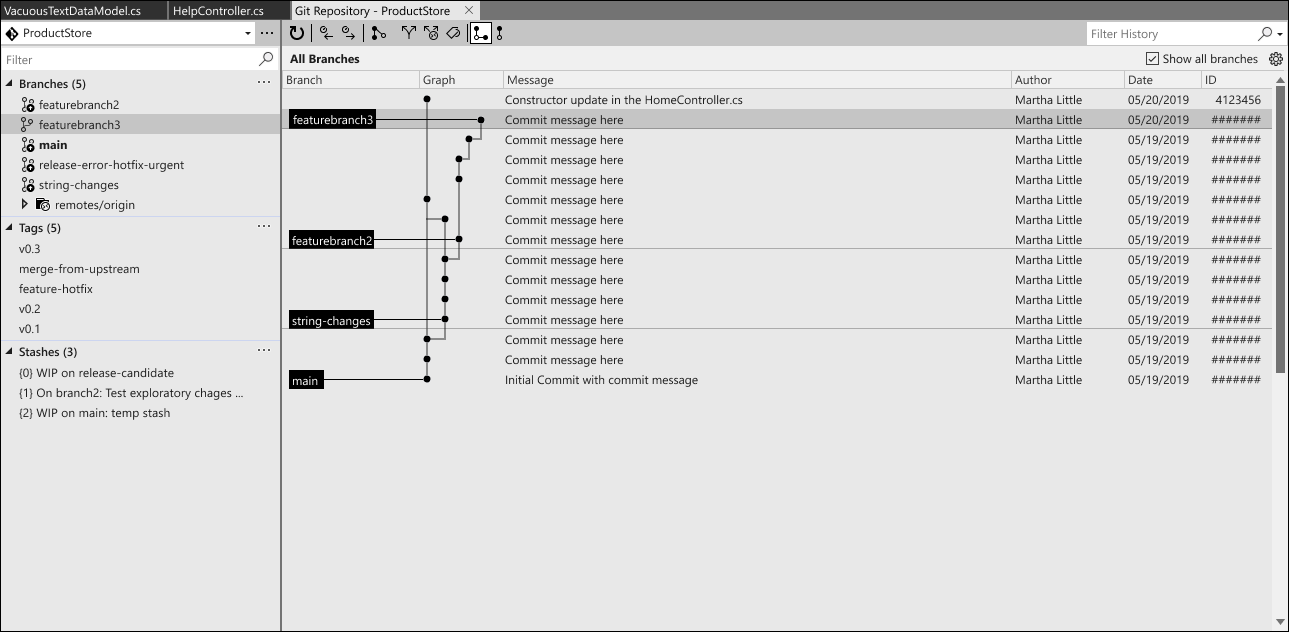
low fidelity multi-branch graph exploration.
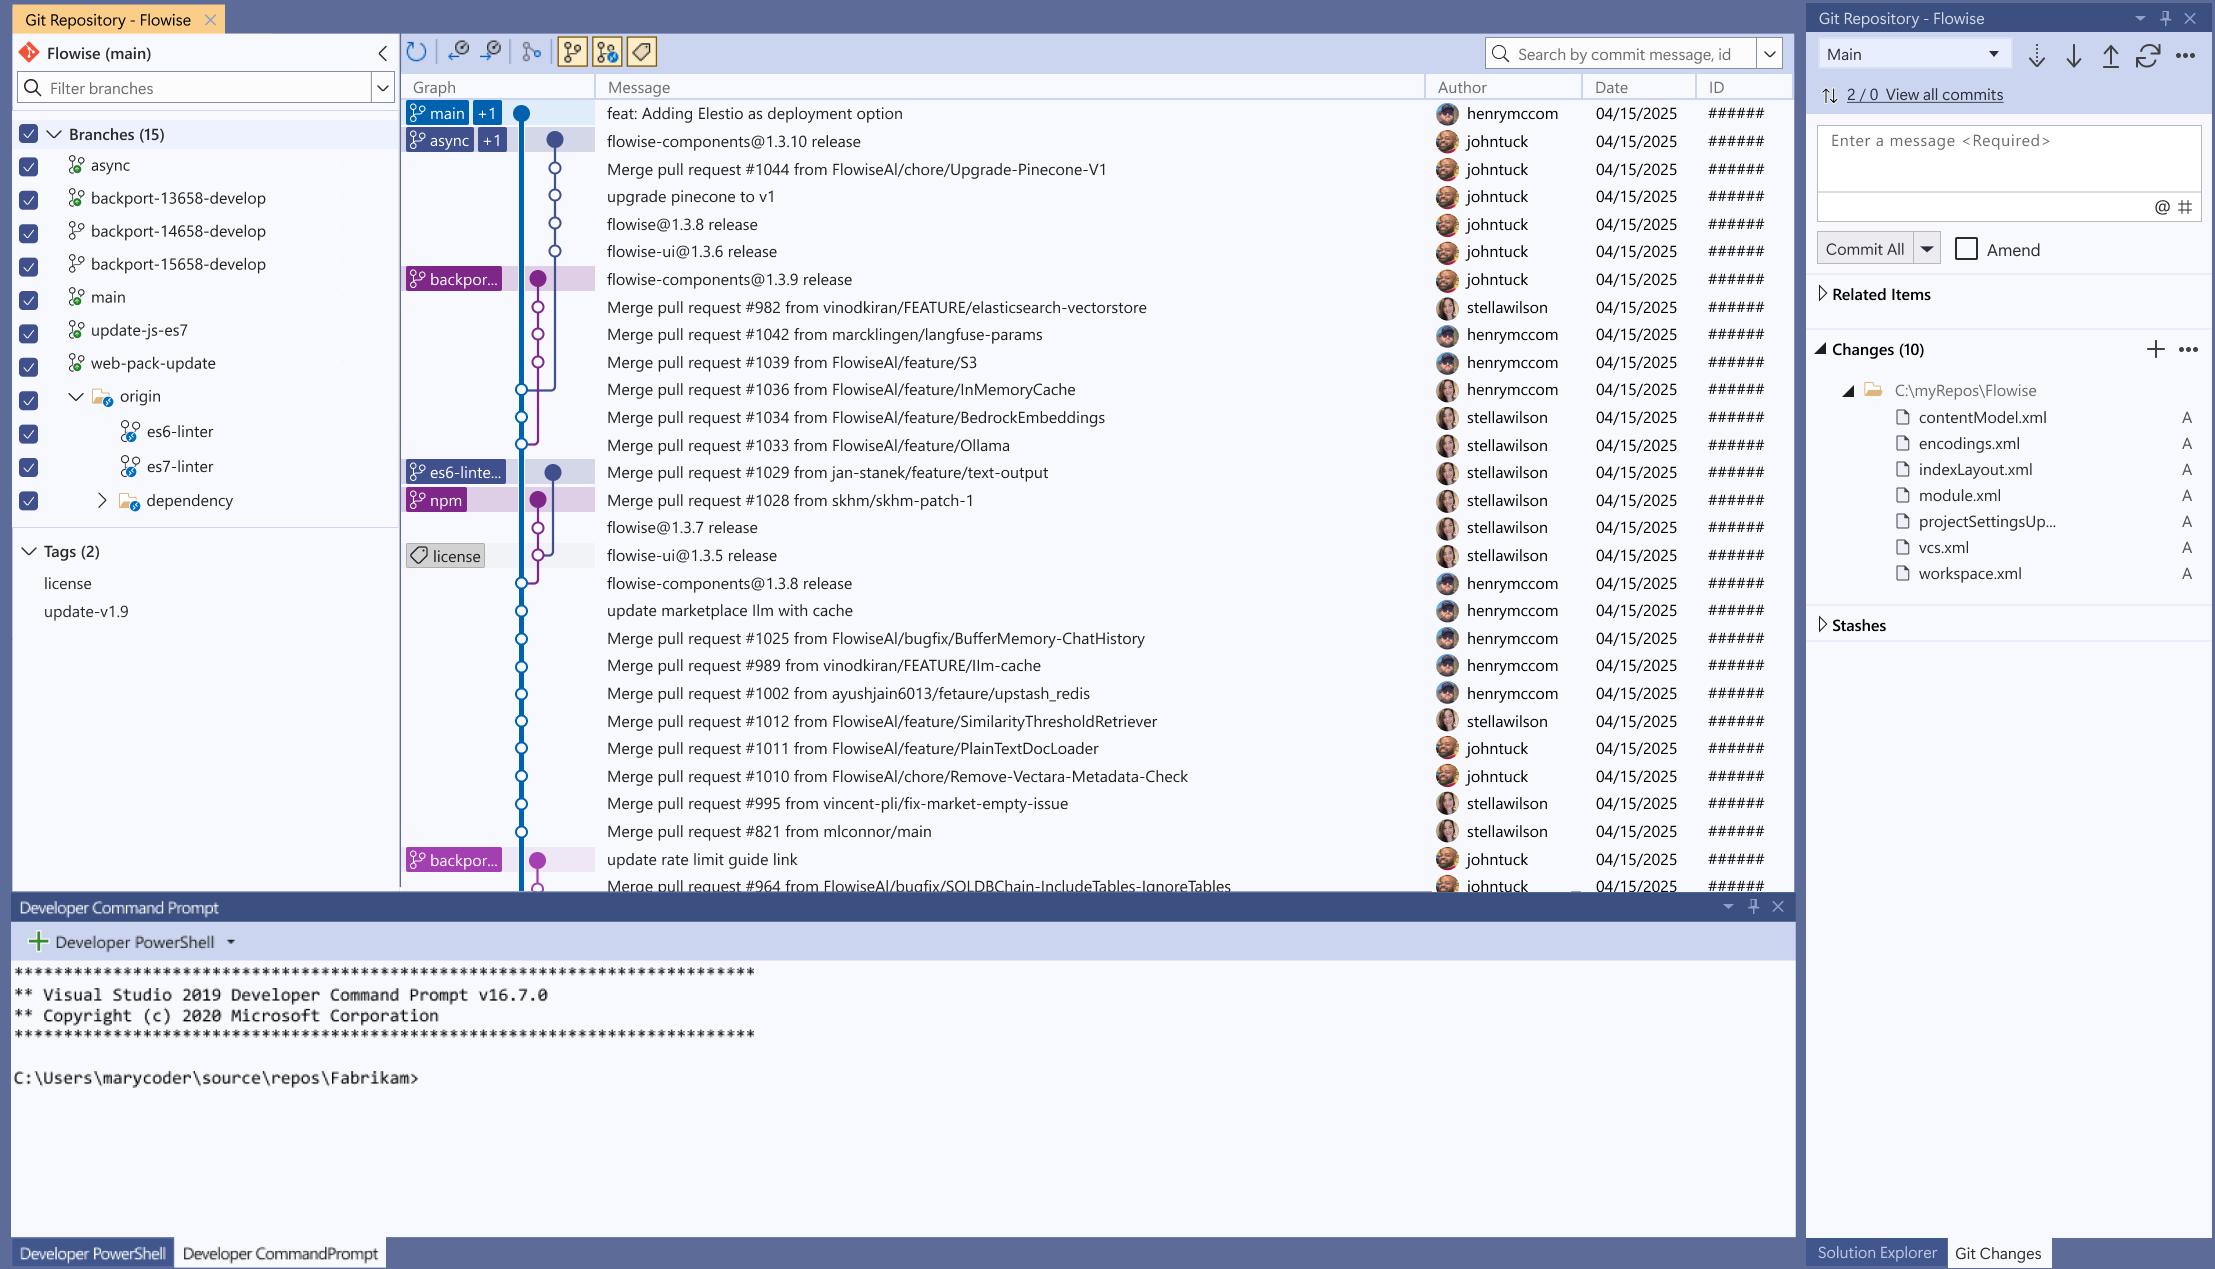
High-fidelity Figma prototype of the Multi-Branch Graph within the VS shell
Design Process
How we got there
Discovery & Research
Conducted in-depth interviews and weekly usability studies with Visual Studio developers spanning students, indie developers, and enterprise engineering teams. Used Lean UX cycles to compress the research loop instead of batch research at the start of the project, we validated assumptions continuously throughout. Identified that the existing branch visualization was the single highest-friction point in the Git workflow, particularly for users managing multiple repositories simultaneously.
Synthesis & Framing
Synthesized weekly study findings in rapid debrief sessions with PMs and engineering leads. The dominant insight was clear: developers managing multi-branch workflows had no accessible, at-a-glance way to understand repository state inside Visual Studio. Third-party tools like GitKraken and Sourcetree were filling the gap users were leaving the IDE entirely for visualization. The opportunity: bring a modern, accessible branch graph natively into VS.
Ideation & Accessibility-First Design
Designed the Multi-Branch Graph from the ground up with WCAG 2.1 AA and Microsoft Accessibility Standards as non-negotiable constraints not afterthoughts. Explored multiple graph rendering approaches and color systems that would convey branch topology without relying solely on hue. Partnered closely with the engineering team to align on what was technically feasible within the Visual Studio shell, using that dialogue to sharpen the design rather than treat constraints as blockers.
Prototyping & Validation
Built high-fidelity Figma prototypes replicating the Visual Studio shell and ran weekly usability studies on the Git Graph throughout the design cycle. This continuous validation rhythm rather than two or three big rounds allowed the team to catch and correct issues early, compress iteration loops, and ultimately accelerate final delivery by one month compared to the original project timeline.
Delivery & Measurement
Partnered with PMs and engineers from design through to ship, maintaining design intent through implementation review and close collaboration on edge cases. The Multi-Branch Graph launched to the full Visual Studio user base. Post-launch telemetry tracked adoption growth from 8.5 million to 14 million users a 60% increase validated through VS usage data and developer community sentiment across forums and the Developer Community feedback portal.
Key Design Decisions
What we changed and why
Accessibility-first graph design
Before
Branch visualization relied on color alone to distinguish branches unusable for developers with color vision deficiencies, and non-compliant with Microsoft Accessibility Standards.
After
A multi-cue system using color, shape, pattern, and label density to convey branch topology. 100% WCAG 2.1 AA compliant, passing both automated and manual accessibility audits.
Lean UX over big-batch research
Before
Traditional project cadence: large research phase upfront, limited testing mid-project, and no validation until late-stage prototype review compressing iteration time at the worst moment.
After
Weekly usability studies baked into the sprint cadence from day one. Issues surfaced and corrected continuously rather than in expensive late-stage rework delivering the project a full month ahead of schedule.
PM & engineering co-design
Before
Design handoffs that treated engineering constraints as implementation details to solve later often surfacing incompatibilities that required design revision after significant Figma work.
After
Weekly triads with PM and engineering from kickoff through launch. Technical constraints shaped design decisions earlier, reducing late-breaking rework and sharpening the product's competitive differentiation.
Outcomes
Results that exceeded the brief
8.5M → 14M
User growth
Multi-Branch Graph adoption scaled from 8.5 million to 14 million users a 60% increase driven by improved usability and accessibility reaching previously excluded developer populations.
100%
WCAG compliant
Delivered fully WCAG 2.1 AA and Microsoft Accessibility Standards compliant data visualizations ensuring complex branch topology was accessible to developers with visual impairments.
−1 month
Delivery accelerated
Weekly Lean UX usability cycles compressed iteration time and surfaced issues early allowing the team to ship one full month ahead of the original project schedule.
Owned
End-to-end design
Led design for Git tooling used by millions of developers globally, influencing product strategy and competitive positioning through close partnership with PM and engineering.
Reflection
What I learned
The biggest shift on this project was treating accessibility as a design constraint from the very first sketch, not a checklist to clear before shipping. Designing the Multi-Branch Graph to be WCAG-compliant from day one meant the accessibility requirements shaped the visual language leading to a richer, clearer visualization that was better for all developers, not just those with visual impairments.
Lean UX transformed how I think about research cadence. Weekly usability studies felt aggressive at first, but the continuous signal they produced was invaluable we were never more than a week away from real user feedback, which meant the team made decisions with confidence rather than assumption. The month we recovered wasn't found at the end; it was saved continuously throughout the project.
Working embedded with PMs and engineers from kickoff reinforced that the best design work happens at the intersection of user needs, business goals, and technical reality not in isolation from any of them. The early technical conversations with engineering directly shaped the competitive differentiation of the final product.
Terance brought a rare combination of deep user empathy and accessibility rigor to this project. The Multi-Branch Graph shipped ahead of schedule and immediately moved the needle on adoption but what impressed me most was how he made the team think differently about inclusive design as a competitive advantage.
Marcus Kim
Principal PM, Visual Studio · Microsoft
Explore more work
See all projects